The Information You Need to Thrive in Today’s Google Landscape
This study presents never-before-seen information on how Google’s search features impact click-through rate (CTR) behavior in the search results. To our knowledge, this will be the first such study that marries actual rankings data with real clickstream data.
Key findings in this report include (but are not limited to):
1. As others have reported, no-click queries are a significant part of all searches, but we found that these appear to be much less significant on commercial queries (SERPs that show ads). Clicks go to ads on 28% of all searches with ads, with around 23% of those coming at the expense of ”no-clicks” (clicks that don’t result in a click to a website) and the remaining 5% coming at the expense of organic search. As a result, the impact of ads on organic search clicks appears to be fairly small.
2. Traditional CTR models that have been published are largely meaningless because they don’t separate CTR behavior for branded queries from non-branded queries. For example, CTR for position 1 on branded queries was 69% in our data and only 19% for non-branded queries.
3. CTR for queries with featured snippets are slightly higher than they are for queries without, but the difference is small enough as not to be significant. Our conclusion is that there are probably many types of featured snippets that give users that answer they want and CTR drops, but that these are offset by other featured snippets that drive much higher CTR.
We will show a number of detailed scenarios below for many different types of search features and their impact on CTR.
Our partner in this project is AuthorityLabs Data Services. They identified 2M queries to track the spread across five different markets (auto, beauty, finance, retail, and travel) with roughly 400K keywords per market. AuthorityLabs followed the ranking data and provided us the clickstream data for these 2M keywords daily for thirty days.
Perficient Digital then performed a detailed analysis to pull together this study. If you’ve heard enough of the overview and want to get right to the data, jump ahead to the section titled “The Basic Data.”
Also, in the “Detailed Analysis” section of this study, we’ll discuss how you can prosper in the brave new world of search.
Detailed Methodology
AuthorityLabs tracked approximately 2M queries split into five categories – auto, beauty, finance, retail, and travel – with roughly 400K queries each. Rankings for each of these queries were tracked daily for thirty days. The data included traditional ranking data information, as well as a detailed data set showing what search features were present in the Search Engine Results Pages (SERPs) in each daily snapshot.
The tracked search features included:
• Ads
• Featured Snippets
• Image Carousels
• Job Packs
• Knowledge Graph Results
• Local Packs
• News Carousels
• People Also Ask Boxes
• Related Searches
• Shopping Results
• Sitelinks
• Video Carousels
AuthorityLabs also pulled clickstream data for each of these queries for the same thirty-day period. AuthorityLabs then provided this data (all 3 terabytes of it!) to the team at Perficient Digital, and we conducted a detailed analysis.
Through our analysis, we were able to amass specific data on the impact of search features on CTR within the search results. We were also able to slice the data by each of the five markets, which allows us to show how search behavior differs across these markets.
The Basic Data
In aggregate, we looked at the outcome of nearly 250M searches. This resulted in 134M organic clicks, 11.3M paid clicks, and 102M no-clicks. Thirty-seven percent of the searches occurred on mobile devices and 63% on desktop devices. Please note that this 37/63% split is not indicative of the market-wide split between desktop and mobile, but instead only indicates the distribution resulting from the data collection methodology used. See detailed data on mobile vs. desktop usage here.
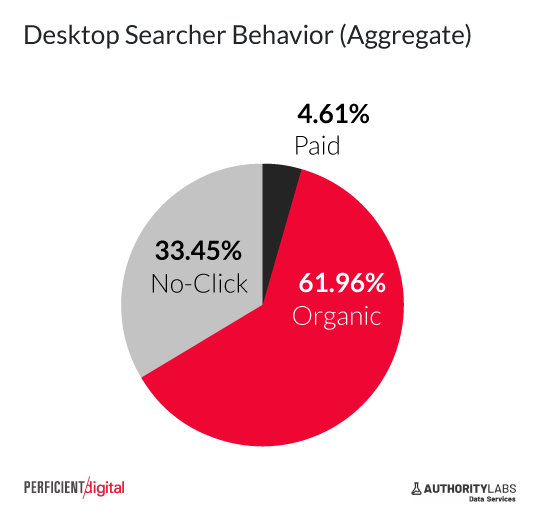
Digging a bit deeper, we can see the distribution of the organic clicks, paid clicks, and no-clicks for desktop devices:
These are the results for mobile devices:
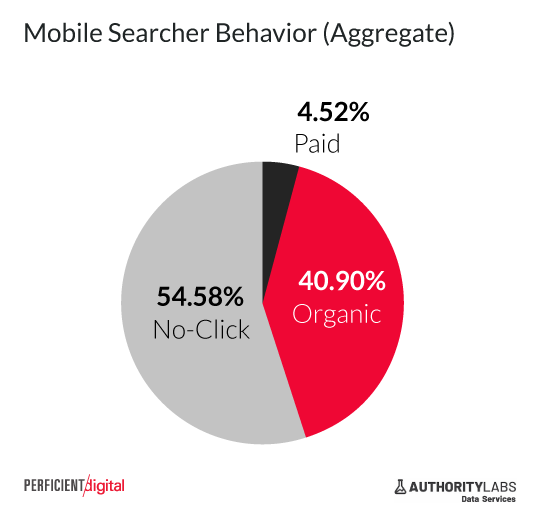
Interestingly, the CTR for paid search is nearly the same for both desktop and mobile, with an average of 4.58%. No-clicks on desktop accounted for about one-third of the total, and 54.5% for mobile. Also of interest is the ratio of organic clicks vs. paid clicks in both environments.
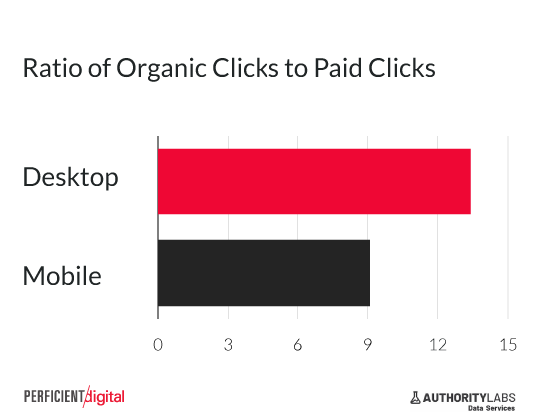
Given that there are 13.4 times as many clicks to organic results as paid results on the desktop and 9.1 times as many on mobile, it’s clear that organic search continues to matter significantly. In light of this data, the ongoing disparity between what brands invest in paid search vs. organic search is stunning. There’s no doubt that the greater certainty that paid search brings is a factor here, but there is substantially more value in investments in organic search.
How Big a Problem Are No-Clicks?
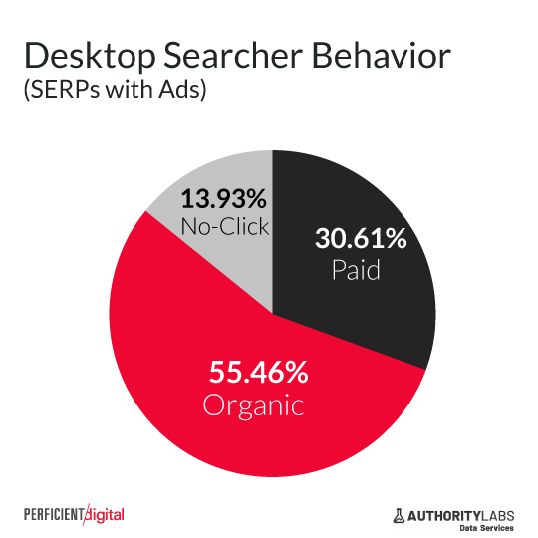
There has been much industry discussion on the impact of the rise of no-click searches (clicks that don’t result in a click to a website). This is indeed an area of concern, but it’s interesting to note that the volume of no-click searches is not nearly as high on commercial queries. Here’s a look at the CTR for all the queries that contained ads:
Now compare that to the CTR for all queries that do not contain ads:
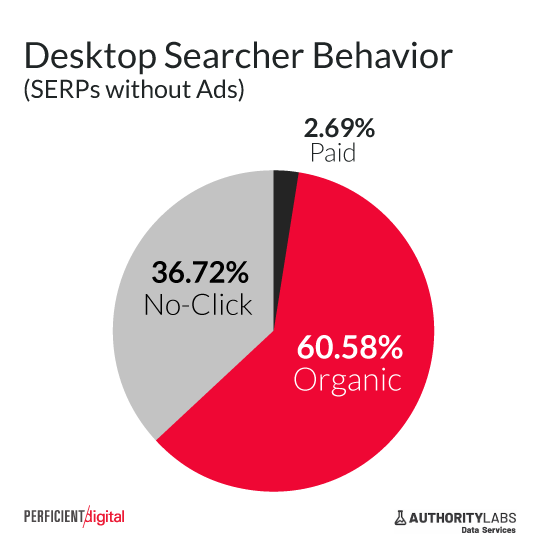
What we see here is that the vast majority of the clicks that go to paid results come at the expense of no-click results. This means that the volume of no-clicks on commercial queries (those with ads) is relatively small, roughly only 14%.
Note: As alluded to by the title for the images, we used the presence of ads as a proxy for identifying commercial queries. While not a perfect measure, it’s an effective method of identifying that class of queries.
What Is the Real Story on CTR by SERP Position?
Capturing data on the CTR by ranking position proved to be an interesting exercise, as it showed us how different CTR is between branded and non-branded queries:
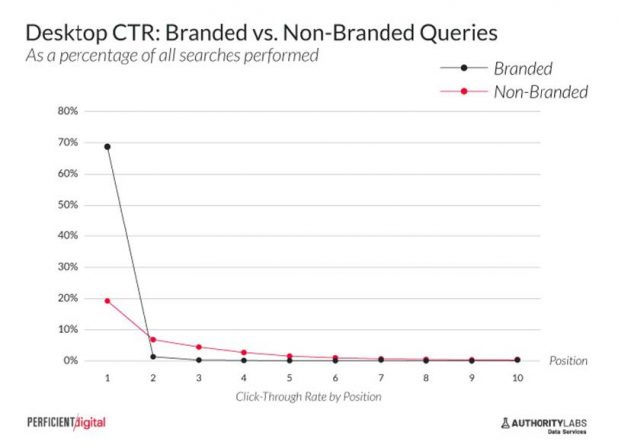
As you can see, the CTR for branded queries is far higher than it is for non-branded queries, and the skew toward position 1 is far greater as well. Based on this, we believe that classical viewpoints on how CTR by SERP position works need to be updated. Past studies have not separated brand queries from non-branded queries, and these have significantly been skewed as a result. CTR for the first position for non-branded queries is actually under 20% (19.23%).
Note: Branded queries were identified here as all queries that have sitelinks associated with them.
Continue reading the full study at: https://www.perficientdigital.com/insights/our-research/impact-of-search-features-on-ctr