What Is Google Data Studio?
Google Data Studio or GDS is a free data visualization tool provided by Google. It automatically reports some things such as the number of transactions in a given time period and total revenue, if you have an ecommerce site. It allows you to create reports and charts for a wide range of metrics from traffic sources to ad performance.
Note that a data visualization tool isn’t going to give you the key performance indicators you want. To do that, you’re going to need to create dashboards that report issues like new keywords bringing in traffic or declining traffic from searches tied to the terms your website is optimized for. For example, an SEO dashboard will tell you which keywords bring in the most paying customers. We’re here to tell you how this can be done.
How to Create an SEO Dashboard in GDS
Set Up the Google Search Console
The first step is getting Google Search Console. You can do this by logging in with your Google account. Then you need to add Google Search Console as a property on the site. The best way to do this is to use the full URL of your website.
An SEO dashboard in data studio will use data from Google Analytics. You do this by “verifying the property”. Then finish the setup.
This will result in the dashboard capturing a wide range of data. You’ll see:
- Total clicks
- Total impressions
- Average click through rate or CTR
- Average position
The average position refers to the search engine results page rank of the webpage for a given keyword or phrase. This is probably the most important metric for those trying to improve the search engine optimization of the website. And you can transfer this data to Google Data Studio.
Send the Data to GDS
Log into GDS. Select “Create”, then choose the data source. In this case, it will be “Search Console”. Then you’ll pick the website you want the data from. Select “Site Impression” from under Tables. If the option of “Property Parameter” of “Web”, select that. Give the data source a name. Then click on “Add” or “Connect”; it could be either one, depending on the options.
Now you can click “Create Report” and then “Add to Report” to finish creating the empty canvas. The next step will be adding data to the report.
Add the Data to the Report Inside of GDS
You’ve created a report that pulls the SEO metrics from your website. But you have to populate the report with the metrics you want to have a viable SEO dashboard. On the blank dashboard, click the option to “Add a Control”. The select “Date Range Control”. Drag it to the canvas to add it to your report.
Select “Add a Chart”. Then click “Scorecard”. Drag that onto the canvas. Select “Add a Chart” followed by “Time Series” and move it to the canvas. You’re going to want to see the data over time. Properly configured reports will update daily based on data from Google.
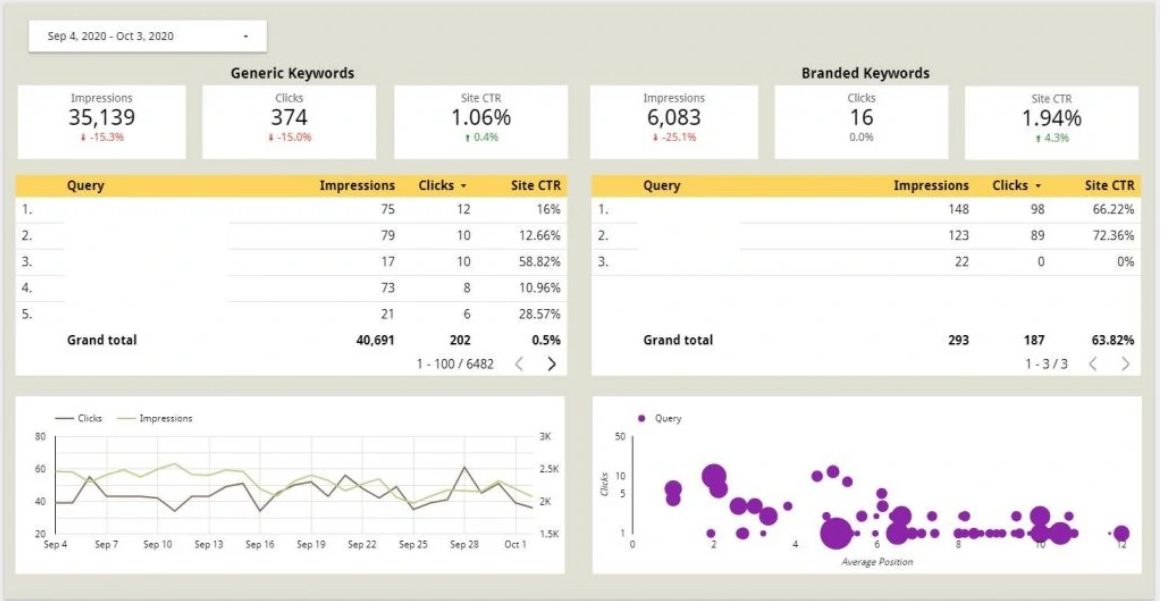
This creates a basic dashboard showing the number of clicks on the website. You can now add more meaning such as impressions and CTR for branded keywords. A good SEO dashboard will include traffic from generic keywords related to your product.
Note that this is only a basic understanding of the SEO of your website. More advanced reports can tell you which niche keywords are bringing in disproportionately more paying customers and low volume queries that have little competition.